Operational dashboard development

Stop chasing spreadsheets. See your operation live.

Web-based dashboards that track your KPIs and turn your data into clear visuals, built by someone who has run the floor and knows which numbers matter at 6 a.m. and which ones matter at month end.

A working dashboard

One shift, in fifteen seconds

Throughput by the hour, dock doors moving, and a plain-English question answered from the data.

Sample company and data, shown for illustration.15-second loop
Pricing

Dashboard packages

Starting prices for typical projects. Every project gets a written quote before work begins.

Starter

You upload spreadsheets or exports; the dashboard does the rest.

Starting at
$2,000

Timeline: 2–4 weeks

  • Up to 6 KPIs
  • 1–2 data sources
  • Data by upload (spreadsheets or exports)

Advanced

Several sources, custom calculations and views for each team.

Starting at
$4,500

Timeline: 6+ weeks

  • 3 or more data sources
  • Upload, connected, or both
  • Custom calculations
  • Multiple views

Dashboard care plans

Care plans cover hosting, secure access, data refresh checks, fixes and 1 hour of changes a month.

PlanMonthlyPaid yearly
Upload-based dashboard$150$1,500 (2 months free)
Connected dashboard$200$2,000 (2 months free)

Bundle and save 15%. Take a website care plan and a dashboard care plan together and save 15% on both. For example, Basic plus an upload-based dashboard is $235 a month instead of $275.

Payment terms
  • Every project gets a written quote before work begins. Prices shown are starting points for typical projects.
  • Projects begin with a 50% deposit; the balance is due at launch.
  • Invoices after the deposit are due within 30 days.
  • Payment by bank transfer (ACH) or card. Checks are not accepted.
  • Sales tax is added where it applies.
  • Prices are subject to change; your written quote is locked for 30 days.
Examples

Inside a sample dashboard

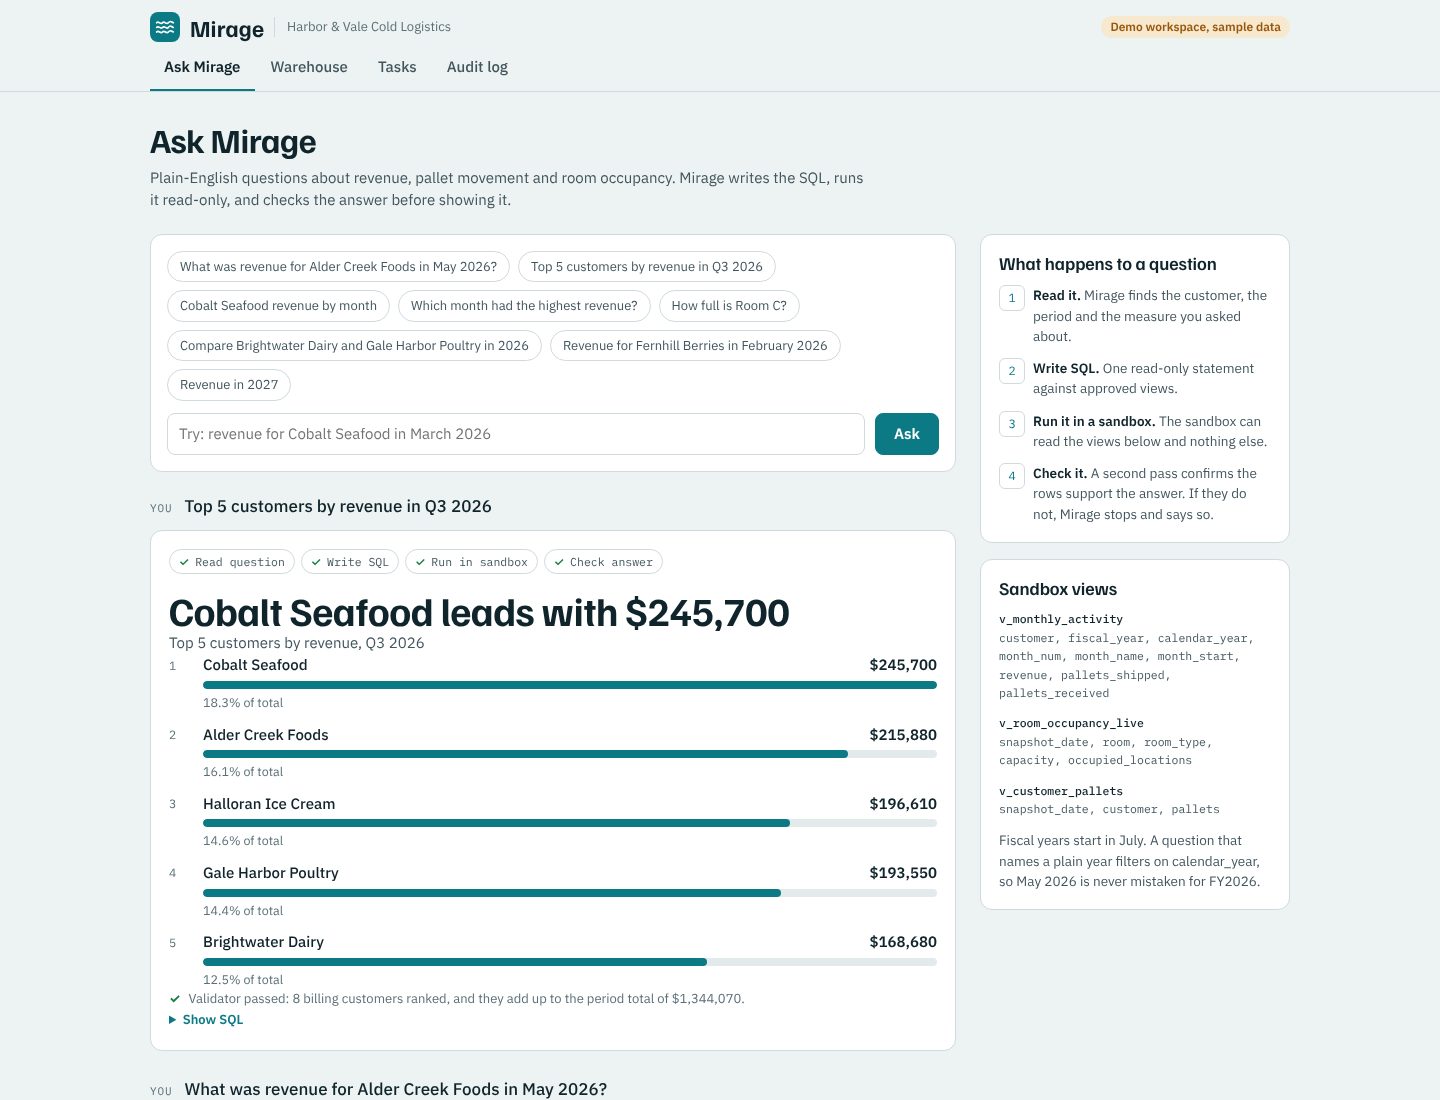
Screens from Mirage, a demo operations workspace for a fictional cold-storage company. Every name and number is invented.
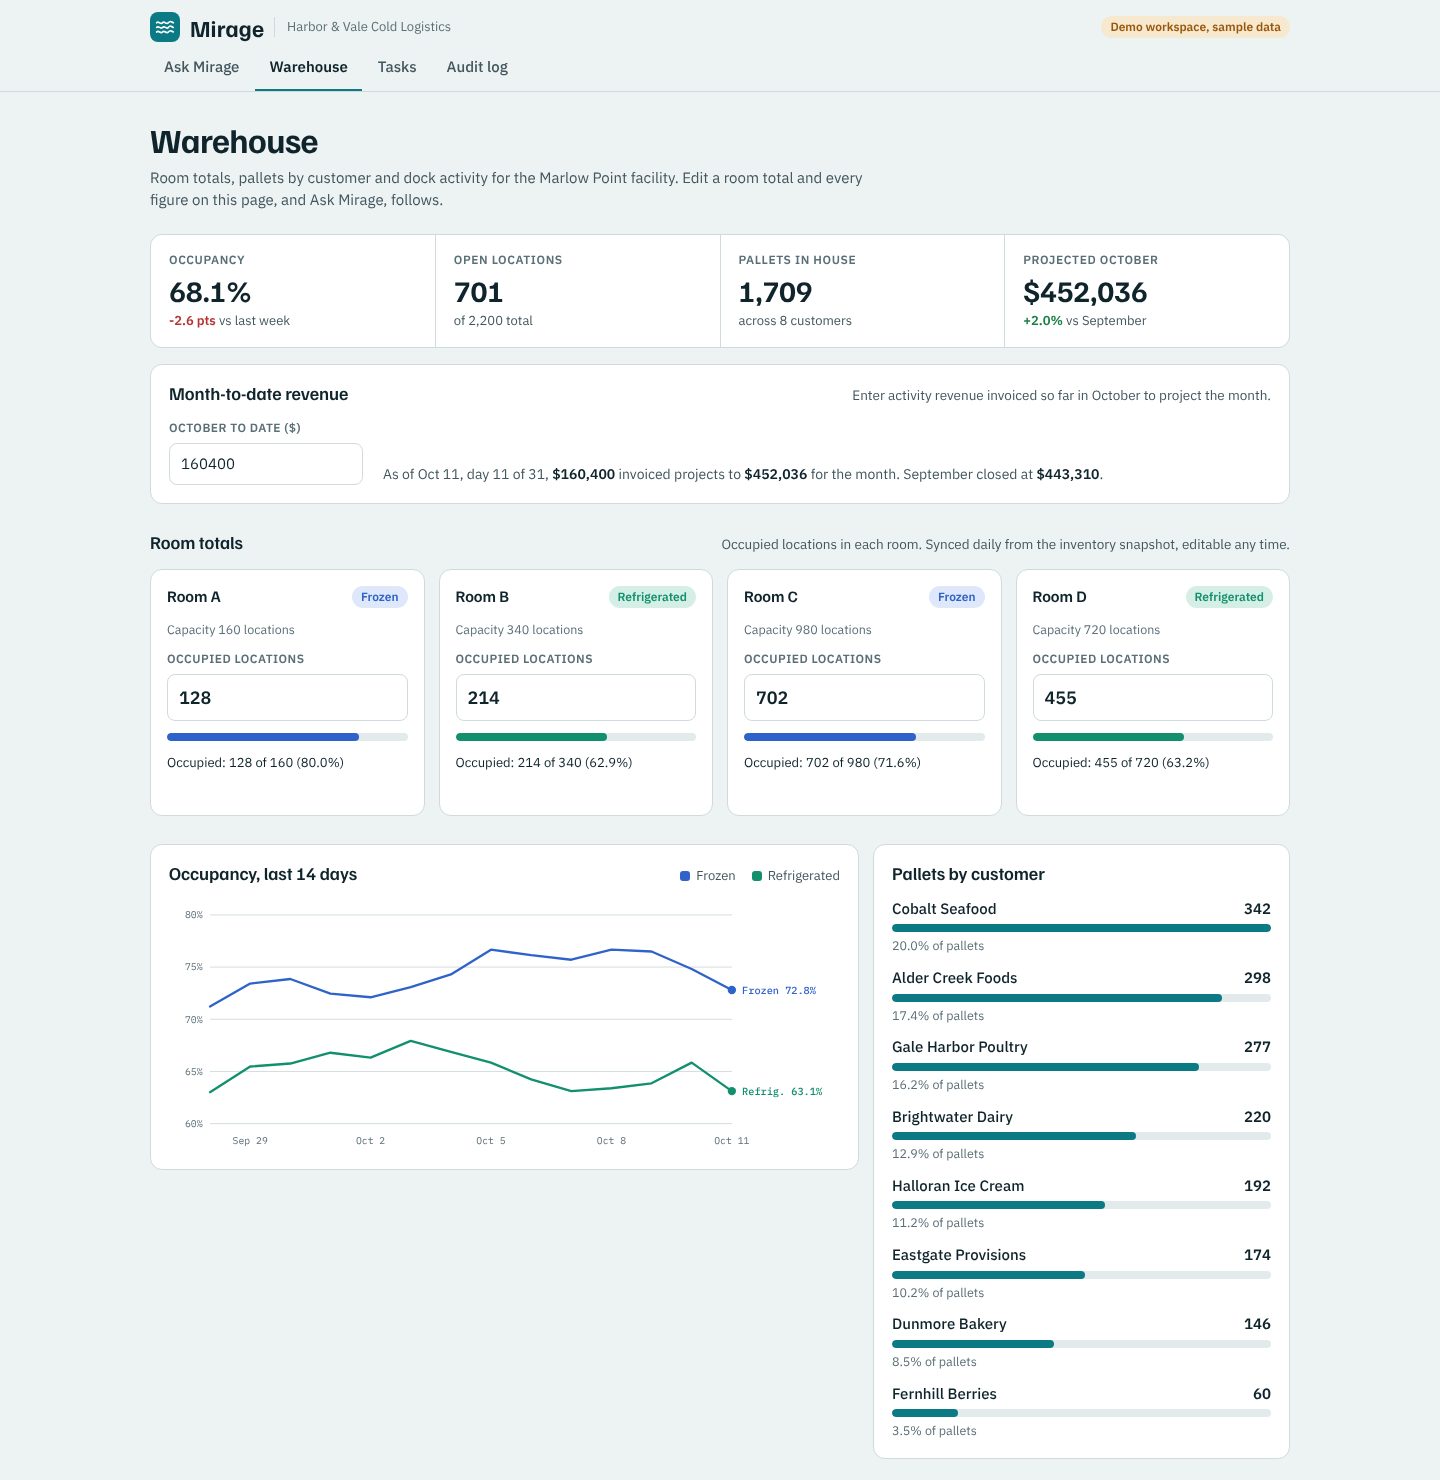
Warehouse view: Occupancy by room, pallets by customer, a 14-day trend and a live dock board.
Warehouse view. Occupancy by room, pallets by customer, a 14-day trend and a live dock board.
Ask the data: Plain-English questions answered from approved data, with every answer checked before it's shown.
Ask the data. Plain-English questions answered from approved data, with every answer checked before it's shown.
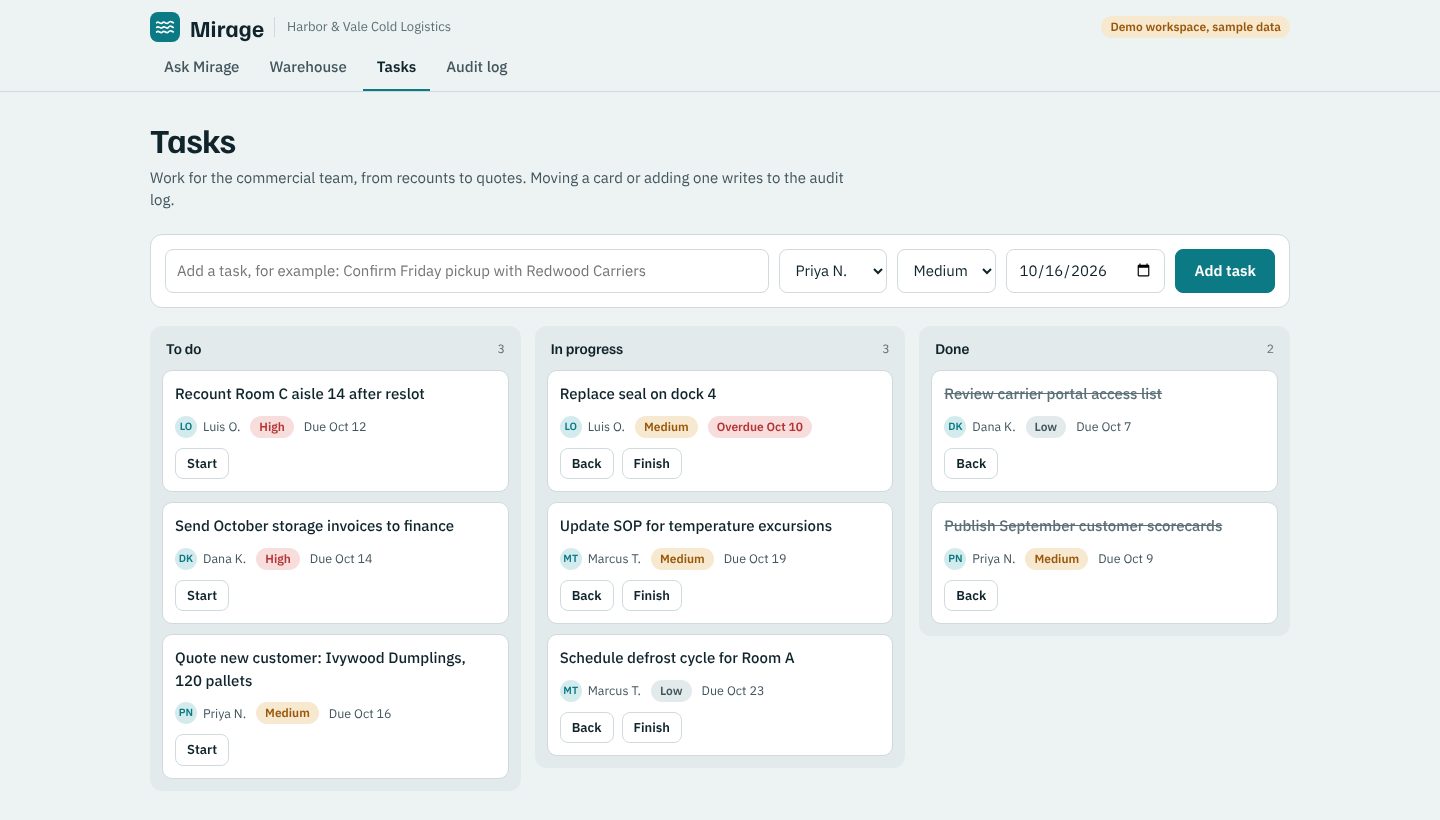
Team tasks: Work assigned, tracked and logged in the same place as the numbers.
Team tasks. Work assigned, tracked and logged in the same place as the numbers.

What would you track if it were easy?

Send me the reports you pull by hand today. I'll show you what a dashboard could do with them.